Understanding Details of Flight Test Data Analysis
Academic Flight’s Applied Flight Test Engineering Course Series strengthens the understanding of flight test data analysis by implementing many theoretical calculations in Python, which requires having all the equations. This includes charts and graphs which you may otherwise just use as a flight test engineer or test pilot. As an illustration, we give several examples below.
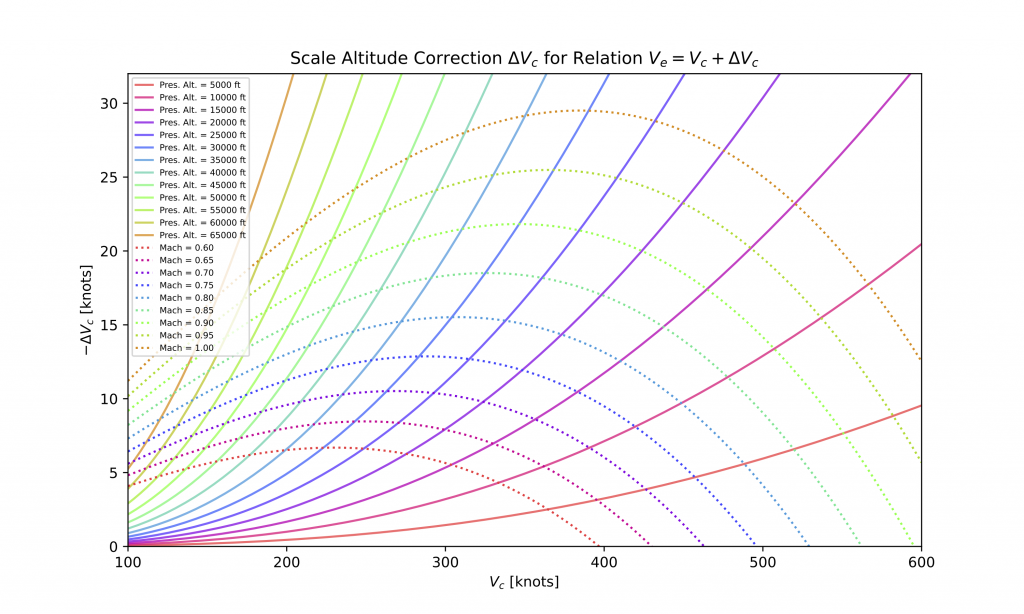
Example 1: Scale Altitude Correction
Scale altitude correction, \(\Delta V_c:= V_e-V_c\), is the correction one performs, when going from calibrated airspeed \(V_c\) to equivalent airspeed \(V_e\). The scale altitude correction plot is not difficult to make. However, it is still helpful to have thought through it once. In addition, it gives you practice making visually appealing flight test engineering plots in Python with Matplotlib.
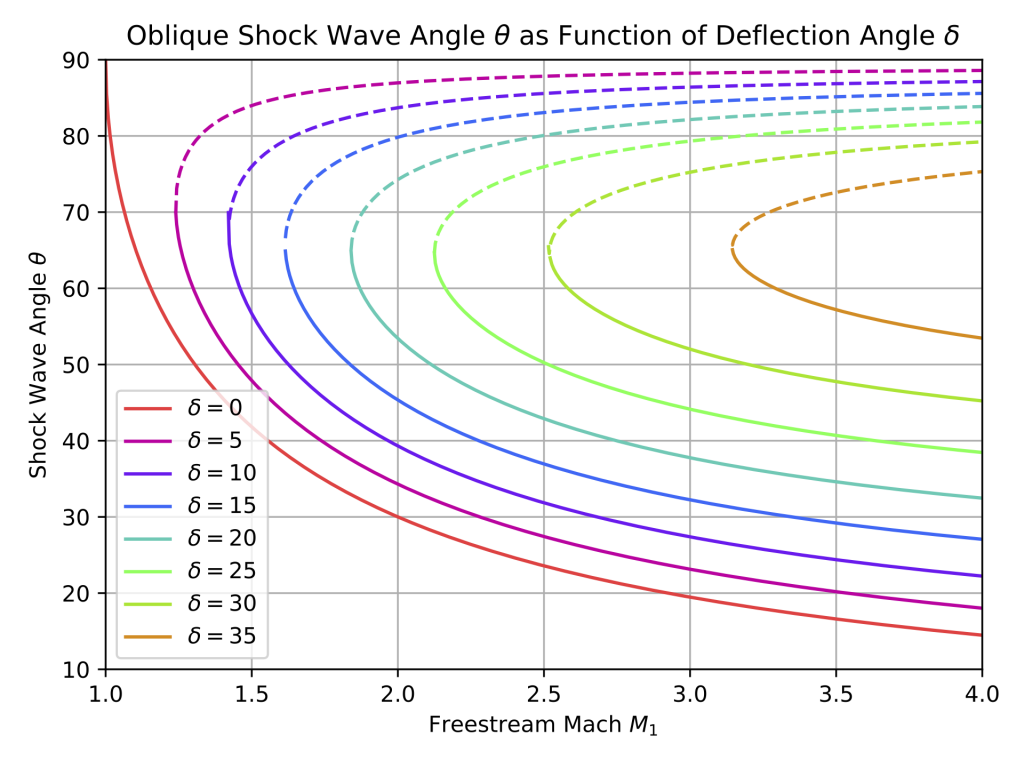
Example 2: Shock Wave Angle \(\theta\) of an Oblique Shock
In supersonic aerodynamics, given oblique shock wave angle \(theta\) and incoming freestream Mach number \(M_1\), it is easy to compute the deflection angle \(\delta\). However, in practice, usually the opposite problem arises. Knowing the geometry given in the problem, you know the deflection angle \(delta\) and freestream Mach number \(M_1\), and you need to figure out the shock wave angle \(\theta\). This is not quite as straightforward, and making the corresponding plot, you will develop an appreciation for it, as well as code which you will then be able to incorporate in your flight test data analysis software.
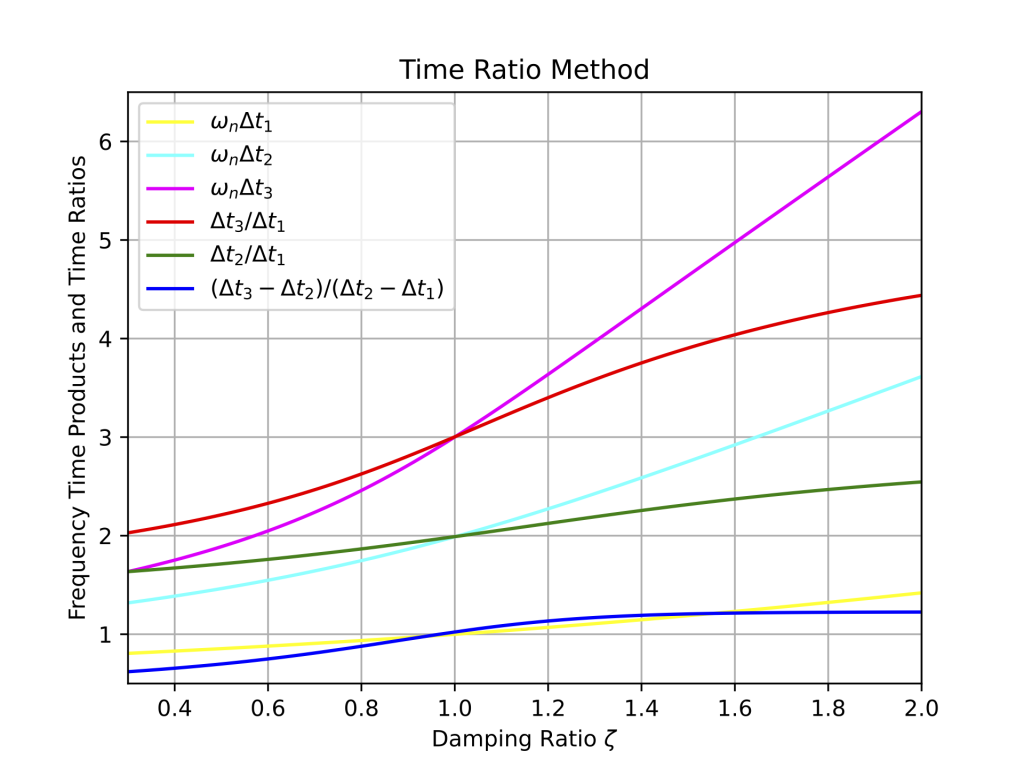
Example 3: Time Ratio Method
During the motion analysis discussion in the flying qualities chapters of the Applied Flight Test Engineering Course Series, the need will arise to infer damping ratio \(\zeta\) and damped frequency \(\omega_d\) from time domain data describing the free response of an aircraft to a disturbance. In the case of two or fewer overshoots, the Time Ratio Method is applicable. The procedure requires inferring the damping ratio from specific time ratios in the plot below. The time ratios are constructed from frequency time products. The graph below is used to get the corresponding value of \(zeta\)—a graph which you will reproduce with your own code, after we go through the underlying mathematical derivation in our courses.
Conclusion
We hope that the above random examples helped you get a feel for the benefits of diving into the details of flight test data analysis. If you want to automatize your flight test data analysis with Python codes, you cannot have elements in your data processing pipeline which require human intervention, like reading off something from a graphical chart. You need to be able to reproduce the chart yourself, so that the associated calculation can be automatically integrated into your flight test data processing codes.