Many introductory lessons are available for free; see previews under the Curriculum tab above.
In order to purchase the full course, click on the “More Info” button on the right.
One of the most universally useful, fundamental skill sets any professional can acquire in the 21st century is the ability to ingest data into a computer, perform some analysis, and then display these data in a visually appealing way in order to gain insights and to be able to communicate these insights to other people with nice presentation slides. Ideally, this process would be done interactively by programming a computer with step-by-step instructions, in a programming language and environment that make this process very simple and easy to learn, yet powerful and arbitrarily flexible. If possible, this should be learned already while in high school.
This application-oriented, easy to understand, yet ambitious data science and computing course in Python is intended to achieve just that (and admittedly much more). It is aimed at professional pilots, flight instructors, and especially test pilots and flight test engineers, though professionals in other fields and avid high school students will find it interesting as well. It introduces the participants to the basics of computer programming in Python and the Jupyter environment with initial focus on data analysis and data visualization. Mathematical and statistical basics such as matrix calculations in linear algebra, data interpolation, and numerical integration of functions and differential equations are also covered. After these fundamentals, the course embarks into more specialized, advanced topics such as control theory and computer vision, for those who are interested.
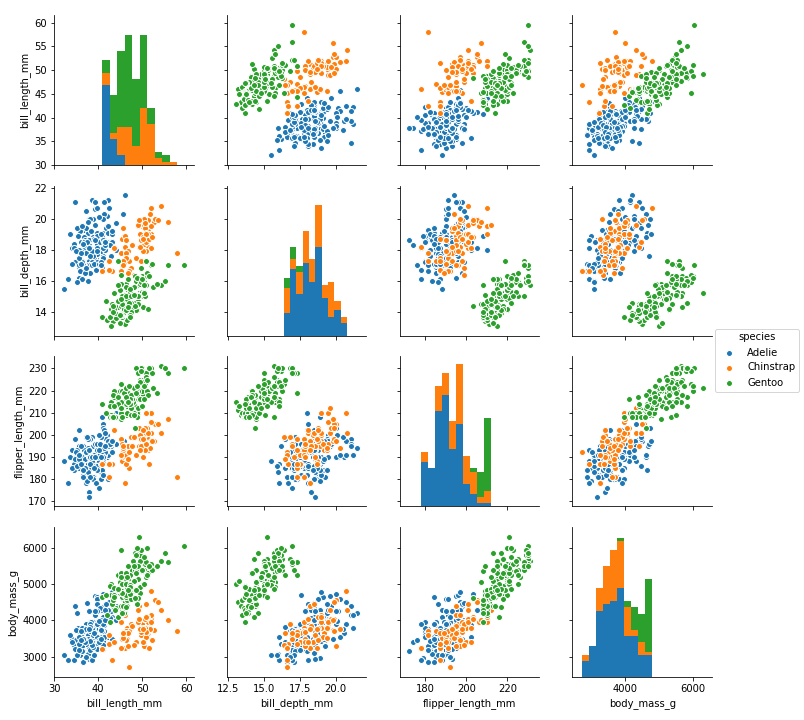
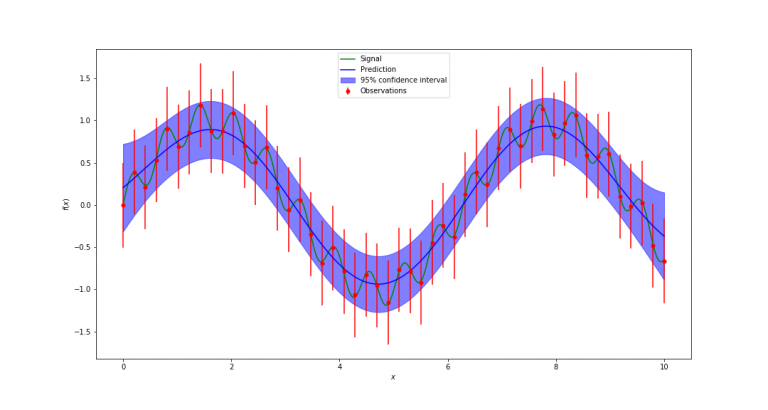
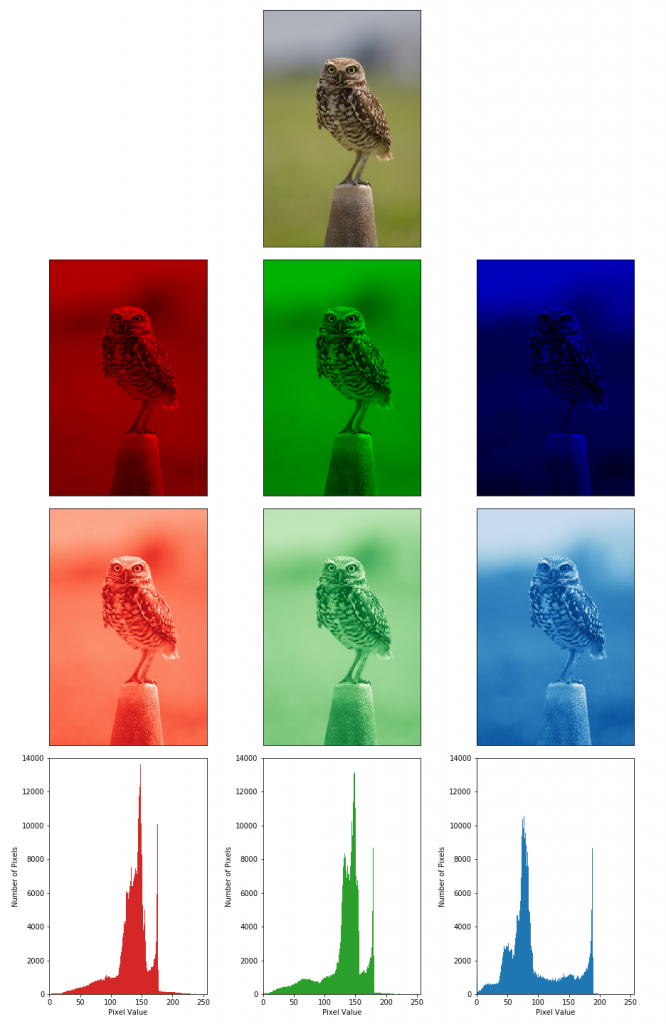
The use of some popular Python modules is explained, such as Pandas for data manipulation, NumPy for linear algebra, Matplotlib and Seaborn for static and animated plotting and data visualization, SciPy for scientific computing including statistics, and – for increasingly advanced applications – OpenCV for computer vision, python-control for control theory, and scikit-learn for basic machine learning.
Various aviation oriented applications – ranging from flight test engineering to meteorological skew-T log-P diagrams for soaring predictions from upper air soundings of the U.S. National Weather Service – illustrate the diverse use of the knowledge and skills learned in this course, and reinforce the notion that data analysis and visualization in Python are far more versatile than with GUI-based spreadsheet applications such as Microsoft Excel.